SubnetSleuth: inventory and map a network you inherit
A Windows desktop app and command-line tool for taking stock of a network you are now responsible for but did not build. It reads the network's own devices over SNMP, read-only, and works out what is there and how it is wired: devices, links, subnets, VLANs and every host, with a topology map, a deep Nmap scan of any address, and exports for the team.
What it is
Taking over a network is mostly archaeology. An acquisition, a handover from a departing engineer, or a new job: the network comes with a spreadsheet that was last right two years ago and a diagram of how somebody meant it to be. SubnetSleuth is for that moment. You give it the address ranges you are responsible for and a read-only SNMP credential, and it reads the network’s own devices to work out what is actually there and how it connects.
It is a Windows desktop app and a command-line tool (Windows and Linux) that share one project file. It is free and open source: the installer, a portable zip and the command-line builds are on the releases page, and the code is at github.com/kerbe42/subnetsleuth.
The tour above was recorded from the app itself, driven by a script. The scan in it is of the simulated campus that ships with the app (Help ▸ Explore the sample network), so it can be shown without pointing at anyone’s real network.
Scanning
A scan starts from the ranges you look after, pasted the way they arrive: CIDR blocks, single addresses or 10.20.0.10-60 style ranges. Any size works. A /16 is swept in full, and the dialog says roughly how long that will take. You can also name a core switch or router to start from, and list ranges that must never be sent anything, such as OT, medical or partner links.
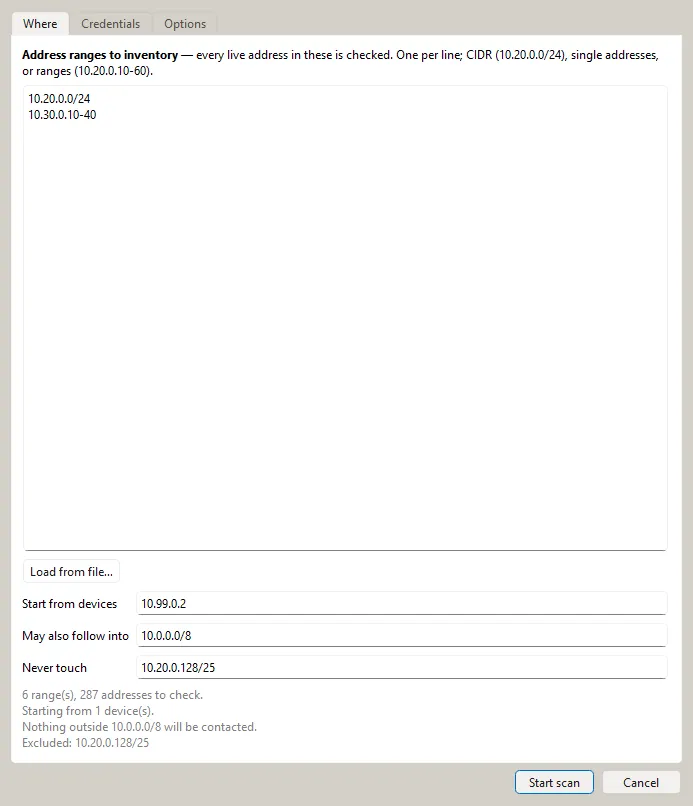
From there it works in stages:
- Find what is alive. Each range is ping-swept with Nmap, one /24 block at a time and eight blocks at once, with aggressive discovery timing so a block of dead, firewall-dropped addresses is given up on in seconds rather than minutes — sweeping several /16s takes minutes, not hours. A block that runs out of time keeps every host it had already found, and the rest is tried again with twice the time.
- Read the devices. Everything that answers is tried over SNMP. From each device it reads LLDP and CDP neighbours, routing tables, ARP and MAC address tables, VLANs, interfaces, hardware and serial numbers. What each device is — a switch, a router, an L3 switch, a firewall, a wireless access point — is decided from the capabilities it and its neighbours advertise, its bridge table and its ports, rather than guessed from its model name, so unfamiliar kit is still typed correctly. Neighbours, next-hop routers and subnet gateways are followed outwards to more devices.
- Identify the hosts. Hosts are identified with small, read-only probes: NetBIOS, mDNS, SSDP, web and TLS banners, SSH banners, and the building and industrial protocols (BACnet, Modbus, EtherNet/IP, IPMI) that show up on real estates.
- Scan ports. Nmap service scans go only to addresses that answered, so it never waits out every port of a switched-off PC.
While it runs, the Activity panel’s Now: line names exactly what is in flight: the /24 blocks being swept, the batch being port-scanned and Nmap’s current stage, the devices being polled. On a large network that line is the difference between “it’s working” and “is it stuck?”.
If the SNMP credentials came with the network, you add them. If they did not — common on a network nobody documented — SubnetSleuth can also try the handful of well-known factory-default community strings, read-only, after anything you did provide. Any device that still answers one is listed under Needs attention so you can change it.
Everything it sends is read-only (SNMP GET and GETBULK, never SET), and every step checks the same scope before contacting an address, so nothing outside your ranges is touched, whichever step found it.
What it works out
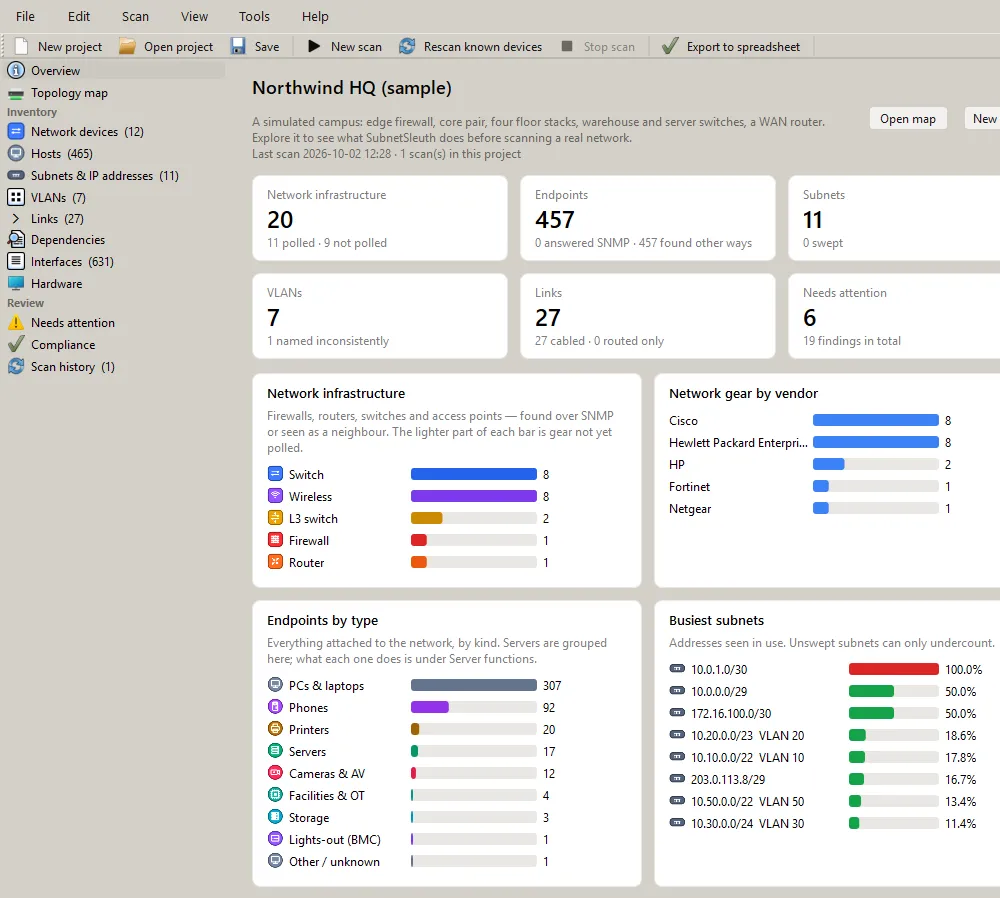
The Overview is the first answer to “what have we got”. It separates the network itself — firewalls, routers, switches and access points, with the gear you have not yet polled shown as a lighter part of each bar — from the endpoints attached to it, grouped by kind (PCs, phones, printers, servers and so on). Alongside are the gear by vendor, the busiest subnets, what each server actually does, and the findings that need attention.
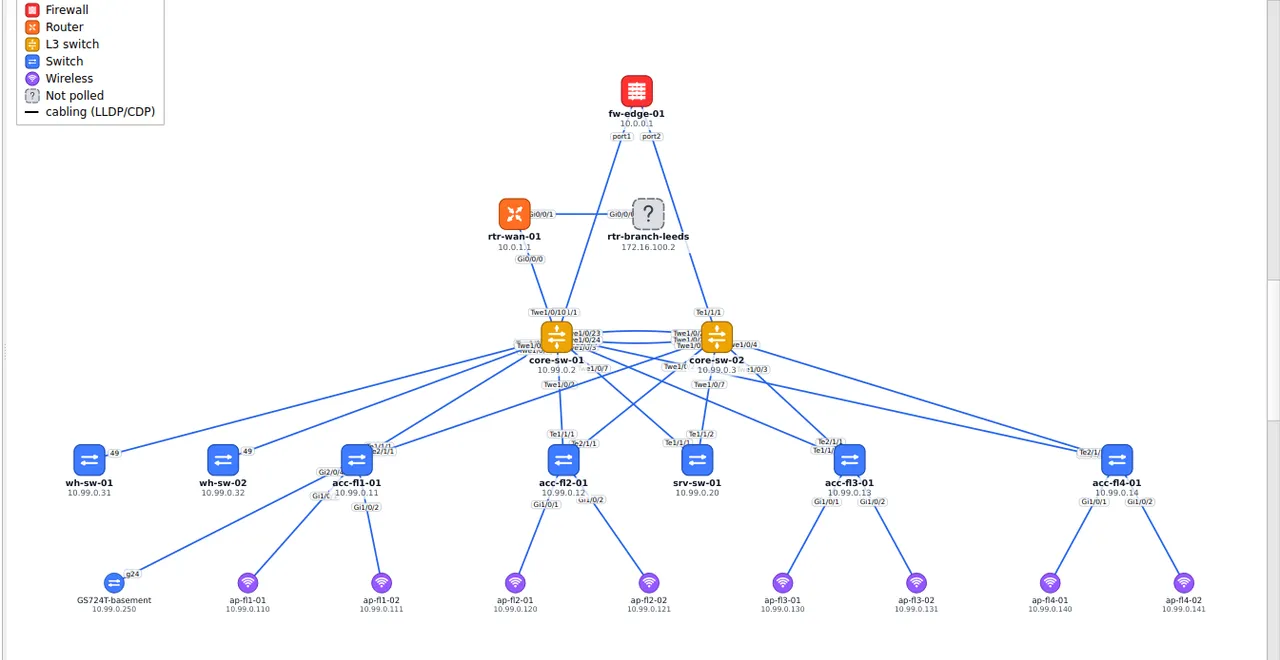
Topology. The physical map is worked out from LLDP and CDP neighbours, so it shows the cabling, including the devices that don’t speak LLDP. Where a network has LLDP and CDP switched off entirely — so the switches report no neighbours at all — SubnetSleuth reconstructs the switch‑to‑switch links from the bridge MAC tables instead: the port through which one switch learns another switch’s address is the port facing it. Those inferred links are drawn dashed, to set them apart from links a device actually reported. The logical map shows subnets, gateways and the routers between them. Maps can be laid out automatically or by hand, positions are saved in the project, and they export to draw.io (and from there to Visio).
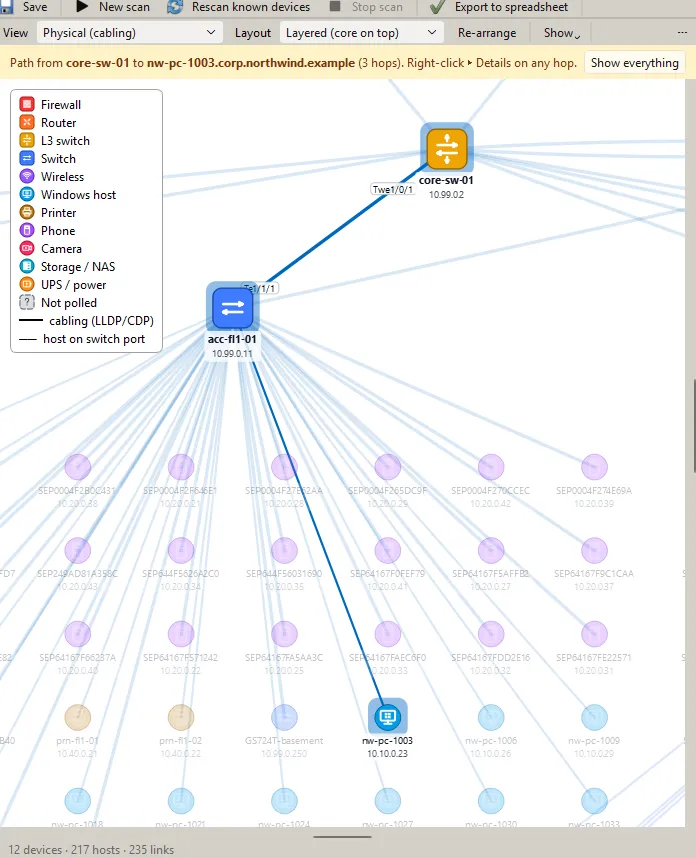
Paths. Pick any address and SubnetSleuth traces the path to it, switch by switch through the MAC tables and router by router through the routing tables, and lights it up on the map.
Devices. Each device has its model, serial number, software version and uptime, its interfaces with VLANs, speeds, errors and PoE, its neighbours, ARP and routing tables, redundancy groups, routing peers and spanning-tree role. Switches get a faceplate of their ports.
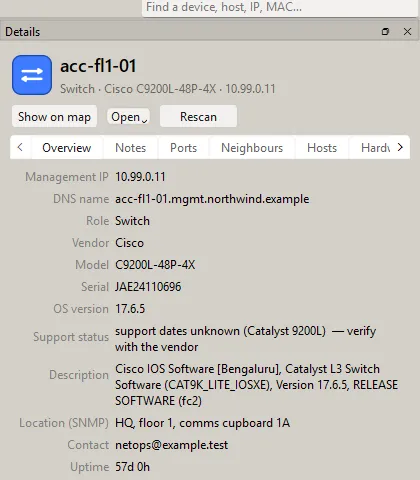
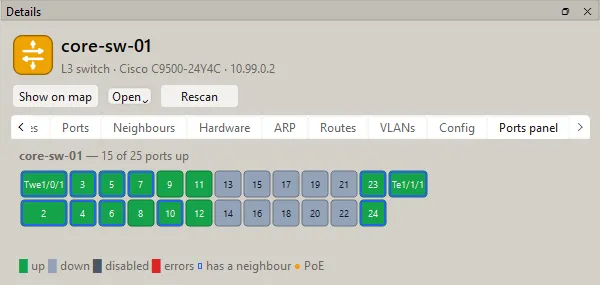
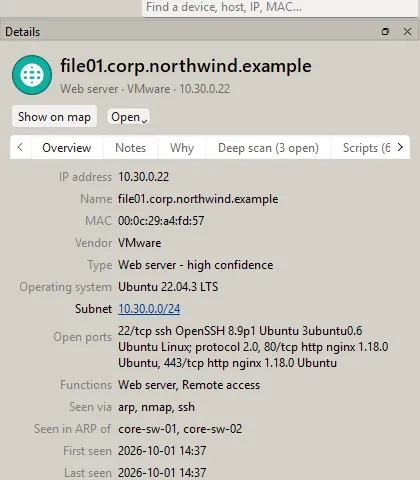
Hosts. Every address seen in an ARP table, a MAC table or a sweep becomes a host, with its vendor, the switch port it is plugged into, and a type (Windows PC, printer, phone, camera, hypervisor, database server…). Each type comes with a confidence level and a Why tab listing the evidence behind it: a MAC vendor, open ports, a NetBIOS name, an mDNS service, a web page title.
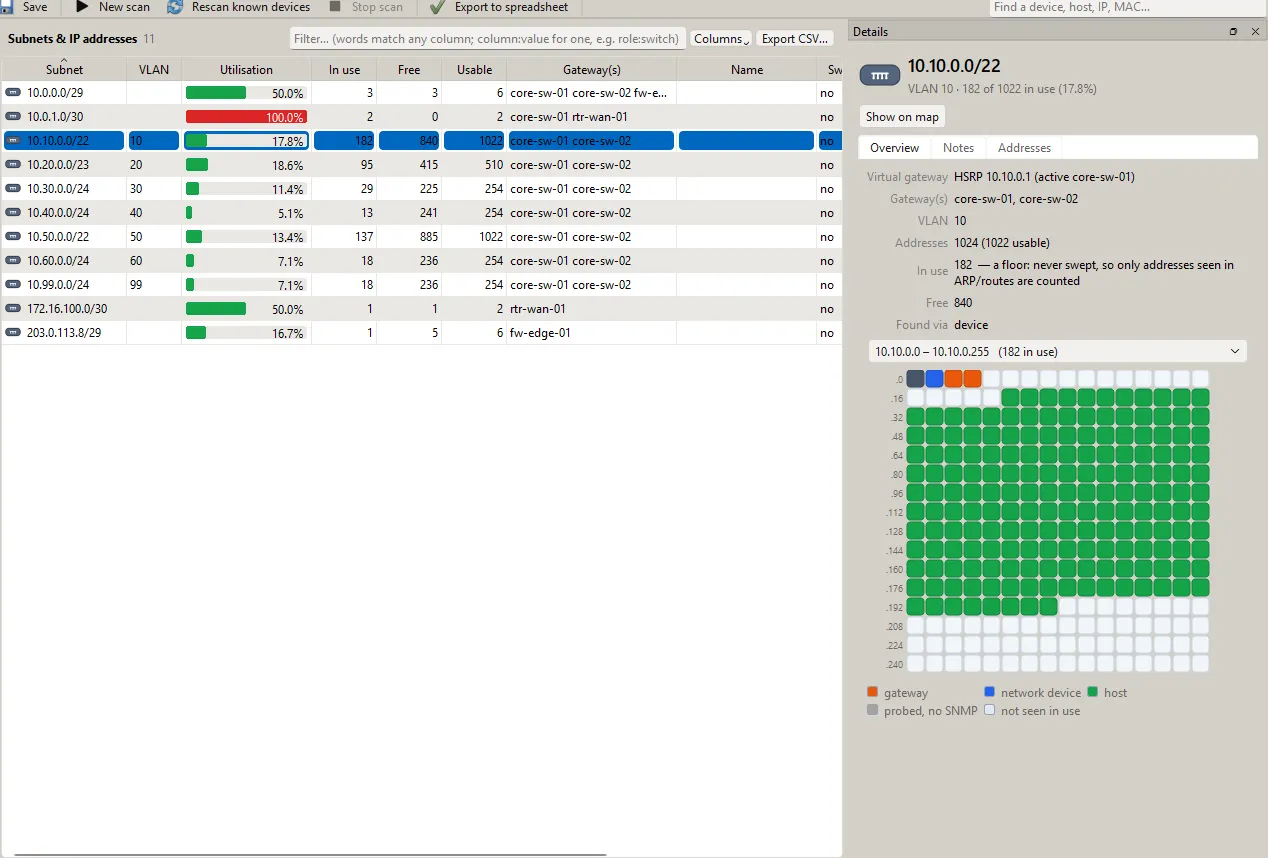
Subnets. Each subnet gets an address map of what is used, what is free and what is on each address, with its gateway, VLAN and utilisation, so you can tell the swept subnets from the ones that are only known from routing tables.
Deep scan
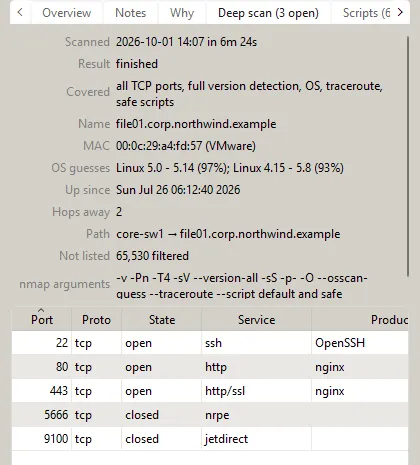
Right-click any device or host, or type an address, and Deep scan with Nmap looks at it as thoroughly as Nmap can. It covers all 65,535 TCP ports, every service-version probe, OS detection and a traceroute, and the common UDP services if you ask. It also runs Nmap’s scripts that are both default and safe, which read TLS certificates, web page titles, SSH host keys and SMB/RDP names, and nothing intrusive. The result stays in the project: every port with its product and version, the OS guesses, the uptime and the path, and a Scripts tab with what each script read.
Keeping it honest and current
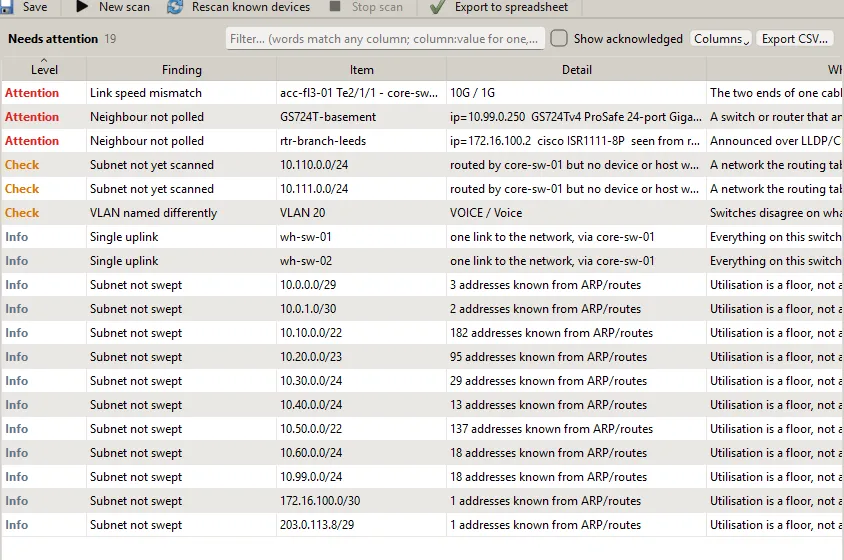
Needs attention collects the things worth acting on: neighbours that were seen but couldn’t be polled, devices that answer SNMP but hide their topology (no LLDP/CDP, MAC table or routes — usually a restricted SNMP view), links whose ends disagree on speed or duplex, VLANs named differently on different switches, subnets whose router was never reached, overlapping subnets, single uplinks. A compliance page checks device configurations against common hardening standards and flags hardware that is past, or nearing, the end of vendor support.
Beyond SNMP, SubnetSleuth can:
- capture running configurations over SSH and show what changed between captures;
- inspect hosts over SSH or WinRM — with your credentials it reads the OS, hardware, installed software, services and live connections (which become a dependency map of who talks to which server), and on Windows the OS product type tells a server, a domain controller and a workstation apart;
- read VMware vCenter;
- import DHCP leases;
- listen for syslog and SNMP traps while you are on site;
- reconcile everything against the asset list you were handed.
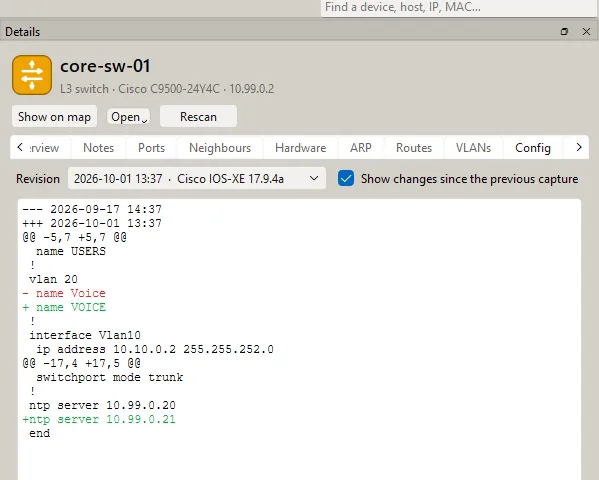
Rescans re-poll what is already known and keep your notes, the map layout and the scan history. Compare with another scan shows what moved, appeared or disappeared since last time.
Sharing it
The project is one file (.sleuth) holding the inventory, your notes on any device, host or subnet, the map layouts and the scan history. It exports an Excel workbook with a sheet per inventory, the draw.io diagram, PDF and CSV. There is also a query language for the inventory (hosts where os ~ windows and confidence = high) and a read-only REST API for scripts.
The command line runs the same scanner for scheduled or repeatable runs:
subnetsleuth crawl --target-file ranges.txt -C env:SUBNETSLEUTH_COMMUNITY \
                   --identify --port-scan --out site.sleuth --xlsx site.xlsx --drawio site.drawio
subnetsleuth deepscan 10.20.0.15 -m site.sleuth
subnetsleuth diff last-month.sleuth site.sleuth
Under the hood
SubnetSleuth is written in Python: asyncio for the scanning, pysnmp for SNMP (v1, v2c and v3), Nmap when it is installed, and a PySide6 (Qt) desktop app. The scan engine has no Qt in it, so the app and the command line run the same code. SNMP secrets are encrypted at rest with Windows DPAPI or the system keyring.
About 400 tests cover it, many of them against a simulated eleven-device campus and real SNMP agents bound to loopback addresses. Every push builds the Windows installer on a Windows machine, starts the built app in a self-test mode that opens every page and every export, and screenshots it. The pictures on this page are those screenshots.